top of page

All Articles
THE DAILY PULSE

Saving and Printing in Microsoft Excel
1. Introduction Saving and printing correctly is essential in: ✔ Finance departments ✔ Bookkeeping roles ✔ Reporting ✔ Client presentations ✔ Audit preparation Incorrect saving or printing can lead to: ❌ Lost work ❌ Incorrect report layouts ❌ Confidentiality issues ❌ Unprofessional presentation This session ensures learners can confidently save and print workbooks in a professional setting. 2. Saving a Workbook for the First Time When you create a new Excel file, it must be s
Feb 203 min read
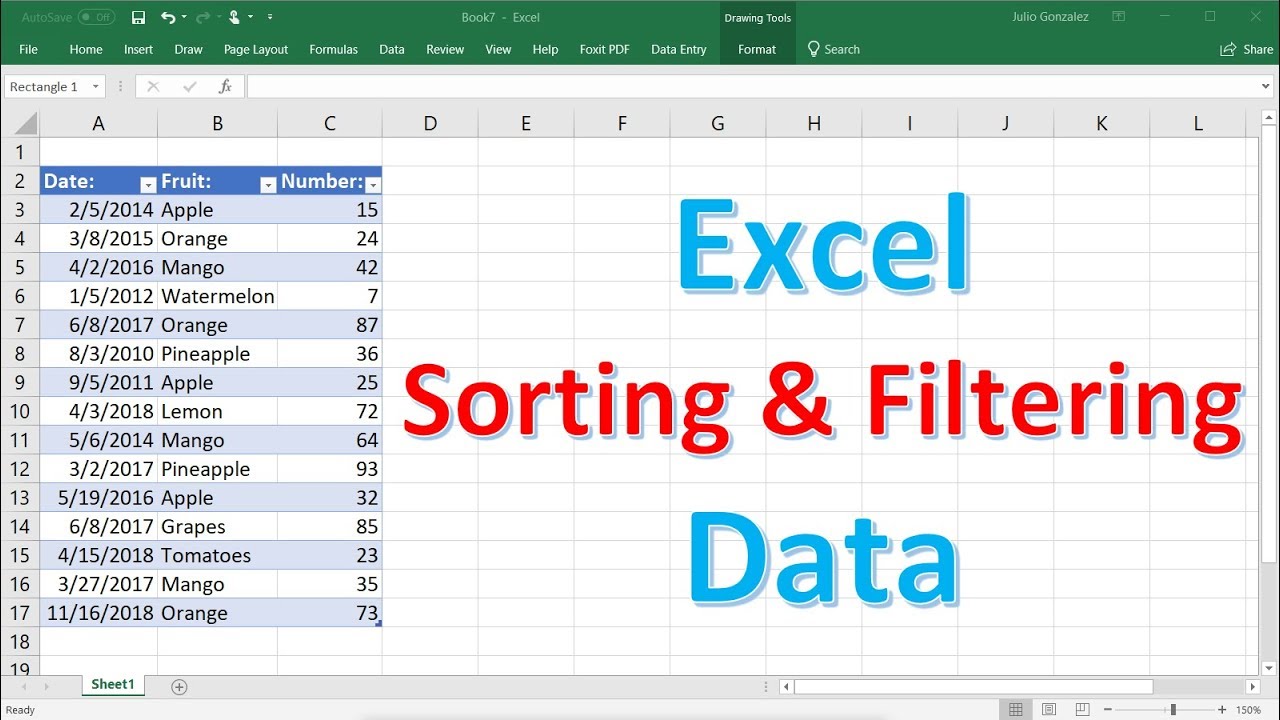
Creating Tables, Sorting & Filtering in Microsoft Excel
1. Introduction Tables, Sorting, and Filtering are essential Excel skills used daily in: ✔ Finance departments ✔ Bookkeeping ✔ Data entry roles ✔ Business analysis ✔ Reporting & dashboards These tools help you organise, analyse, and control large sets of data quickly and professionally. 2. What Is a Table in Excel? A Table in Excel is a structured data range that: Automatically formats data Adds filter buttons Expands automatically when new data is added Makes formulas easier
Feb 203 min read

Creating Basic Charts in Microsoft Excel
1. Introduction to Charts in Excel Charts help you: ✔ Visualise data clearly ✔ Identify trends ✔ Compare performance ✔ Present financial information professionally ✔ Improve reports and dashboards In finance and business, charts make reports easier to understand for managers and stakeholders. 2. When Should You Use a Chart? Use charts when you want to: Compare monthly sales Show profit trends Compare expenses Present financial performance Analyse growth over time Avoid charts
Feb 203 min read

Basic Excel Functions in Microsoft Excel
1. Introduction to Excel Functions An Excel function is a built-in formula that performs a specific calculation. Instead of writing long formulas manually, Excel provides ready-made functions that save time and reduce errors. Functions are widely used in: ✔ Finance ✔ Bookkeeping ✔ Data Analysis ✔ Budgeting ✔ Business Reporting 2. Structure of a Function All functions: Start with = Include the function name Use brackets () Example: =SUM(A1:A5) Structure: =FUNCTION(CellRange)
Feb 202 min read
Basic Excel Formulas in Microsoft Excel
1. Introduction to Excel Formulas Excel formulas allow you to: ✔ Perform calculations automatically ✔ Analyse financial data ✔ Build budgets and forecasts ✔ Create Profit & Loss statements ✔ Automate finance workflows Instead of using a calculator, Excel does the work for you — instantly and accurately. 2. What Is a Formula? A formula is an equation that performs calculations. All formulas in Excel: 👉 Start with an equals sign (=) Example: =5+5 Excel will return:10 3. Unders
Feb 202 min read

Basic Formatting in Microsoft Excel
1. Introduction to Formatting Formatting in Excel improves: ✔ Readability ✔ Professional appearance ✔ Data clarity ✔ Financial presentation standards In finance and business, poorly formatted spreadsheets can look unprofessional — even if the numbers are correct. Formatting helps your data tell a clear story. 2. Understanding the Excel Ribbon Most formatting tools are found under the: Home Tab → Font, Alignment, and Number Groups 3. Changing Font Style and Size To Change Font
Feb 203 min read
How to Insert a New Worksheet in Microsoft Excel
1. Introduction A worksheet (also known as a “sheet”) is a single spreadsheet page within a Microsoft Excel workbook. Each workbook can contain multiple worksheets, allowing you to organise data efficiently. For example, you might use: One sheet for Sales One sheet for Expenses One sheet for Bank Reconciliation One sheet for Profit & Loss Learning how to insert and manage worksheets is a fundamental Excel skill. 2. Understanding Workbook vs Worksheet Term Definition Workbook
Feb 202 min read

MS Excel: Working with Macros Explained
Macros in Excel are used to automate repetitive tasks . Instead of performing the same steps repeatedly, a macro records your actions and allows you to replay them with a single click. Macros save time, improve efficiency, and reduce manual errors. What Is a Macro? A macro is a recorded sequence of actions stored in Excel using VBA (Visual Basic for Applications) . When you record a macro, Excel captures every click, format change, and command you perform — and turns it into
Feb 132 min read

MS Excel: Working with Dashboards Explained
An Excel Dashboard is a visual summary of key information, designed to present data clearly and quickly. Instead of scrolling through rows of numbers, a dashboard displays charts, totals, and performance indicators all in one place. Dashboards help turn data into decisions. What Is an Excel Dashboard? A dashboard is typically a single worksheet that includes: Key performance indicators (KPIs) Charts and graphs PivotTables or summary tables Slicers for interactive filtering C
Feb 132 min read

MS Excel: Working with Power Query Explained
Power Query is one of Excel’s most powerful tools for importing, cleaning, and transforming data. It allows you to automate repetitive data tasks and prepare large datasets quickly and accurately. If you regularly copy, clean, or combine data, Power Query can save you hours of manual work. What Is Power Query? Power Query is Excel’s data transformation and automation tool. It allows you to: Import data from multiple sources Clean and reshape messy data Combine multiple files
Feb 132 min read

MS Excel: Working with Advanced PivotTables Explained
PivotTables are powerful on their own — but Advanced PivotTables take your data analysis to a professional level. They allow you to perform deeper analysis, create dynamic reports, and build interactive dashboards with ease. If you work in finance, operations, or reporting, advanced PivotTable skills are essential. What Makes a PivotTable “Advanced”? Advanced PivotTables go beyond simple totals. They include features such as: Calculated Fields Grouping (Dates and Numbers) Cu
Feb 132 min read

MS Excel: Working with the SORT Formula Explained
The SORT function is a modern Excel formula that allows you to sort data automatically using a formula. Unlike manual sorting, SORT creates a dynamic, live version of your data that updates whenever the source data changes. It’s a simple but powerful tool for building professional reports and dashboards. What Does the SORT Formula Do? SORT arranges data in ascending or descending order based on a column or row you specify. For example: Sort sales from highest to lowest Arran
Feb 132 min read

MS Excel: Working with the UNIQUE Formula Explained
The UNIQUE function is a modern Excel formula that extracts distinct values from a list. It allows you to remove duplicates automatically and create clean, dynamic lists without manual sorting or filtering. If you work with large datasets, UNIQUE is a simple but powerful tool. What Does the UNIQUE Formula Do? UNIQUE returns a list of values that appear only once in a range — removing duplicates automatically. For example: Generate a list of unique departments Extract distinc
Feb 132 min read

MS Excel: Working with the FILTER Formula Explained
The FILTER function is one of Excel’s modern dynamic array formulas. It allows you to extract and display only the data that meets specific criteria — automatically and instantly. Instead of manually filtering or copying data, FILTER creates a live results table that updates as your data changes. What Does the FILTER Formula Do? FILTER returns rows from a range or table that meet conditions you define. For example: Show only overdue invoices Display sales for a specific regi
Feb 132 min read

MS Excel: Working with INDEX + MATCH (Beginner to Advanced) Explained
The combination of INDEX and MATCH is one of the most powerful lookup methods in Excel. While many users rely on VLOOKUP, INDEX + MATCH offers greater flexibility, accuracy, and control — especially in advanced spreadsheets. If you want to move from intermediate to advanced Excel skills, this is an essential technique to master. Step 1: Understanding MATCH (Beginner Level) The MATCH function finds the position of a value within a range. Structure: =MATCH(lookup_value, looku
Feb 132 min read

MS Excel: Working with SUMIFS (Multiple Criteria) Explained
The SUMIFS function in Excel allows you to add values based on multiple conditions . It is an advanced version of SUMIF and is widely used in finance, reporting, and data analysis roles. If you need to calculate totals that meet more than one requirement, SUMIFS is the solution. What Does SUMIFS Do? SUMIFS adds numbers that match all specified criteria . For example: Total sales for January For the Finance department Where the amount is over £1,000 Instead of filtering manua
Feb 132 min read

MS Excel: Working with ERRORS & IFERROR Explained
The IFERROR function in Excel helps you manage and clean up error messages in your formulas. Instead of displaying errors like #DIV/0! , #N/A , or #VALUE! , IFERROR allows you to control what appears instead. This makes your spreadsheets look more professional and easier to understand. What Does IFERROR Do? IFERROR checks whether a formula results in an error. If there is no error , it returns the formula result. If there is an error , it returns a value you choose. The Stru
Feb 132 min read
MS Excel: Working with Nested IF, AND & OR Statements Explained
Excel’s IF function is powerful on its own — but when combined with AND , OR , and nesting, it becomes a highly effective decision-making tool. These functions allow you to create formulas that evaluate multiple conditions and return results automatically. 1️⃣ The IF Function (Quick Recap) The basic structure of IF is: =IF(logical_test, value_if_true, value_if_false) Example: =IF(A2>=50,"Pass","Fail") If the value in A2 is 50 or more, Excel returns “Pass”. Otherwise, it retu
Feb 132 min read

MS Excel: Working with Relative vs Absolute Cell References Explained
Understanding Relative and Absolute Cell References is one of the most important fundamentals in Excel. It ensures your formulas copy correctly and calculate accurately when dragged across cells. If you’ve ever copied a formula and seen unexpected results — this is why. What Is a Cell Reference? A cell reference tells Excel where to find data. For example: =A1 This tells Excel to use the value in cell A1. But how Excel treats that reference depends on whether it is relative
Feb 132 min read

MS Excel: Working with SUMIF Explained
The SUMIF function in Excel allows you to add up values that meet specific criteria . It’s perfect for summarising data, tracking totals, and analysing reports quickly — without manually filtering or calculating numbers. SUMIF is widely used in finance, administration, sales reporting, and operations. What Does SUMIF Do? SUMIF adds together only the numbers that match a condition you specify. For example: Total all sales over £1,000 Sum invoices for a specific client Calcula
Feb 121 min read
bottom of page